Business Intelligence & Analytics
Dashboards
Your Executives
Will Actually Use.
-
ISO 27001 Certified
-
ISO 22301 Certified
- DORA Aligned
-
GDPR Compliant
- Start in 7–10 days
- From €5–6k/mo
HST Solutions builds enterprise Power BI, Tableau, and Looker dashboards on properly engineered data foundations for organisations across Ireland, the UK, and Europe, with semantic layers, governed models, and automated pipelines. ISO 27001 certified.
Who brings in a Managed BI Engineer
- Nobody trusts the numbers
- Excel is still the real BI tool
- Dashboards proliferate, insights don't
- Definitions don't match
You don’t need another BI tool. You need trusted data,
consistent definitions, and reports that actually get used.
Who brings in a Managed Kubernetes Engineer

Finance teams drowning in Excel reconciliation

Executives who don't trust the dashboards

Operations leaders needing real-time visibility

CTOs consolidating reporting tools

Regulated firms needing auditable reporting
If that sounds familiar, we’ve solved it before.

What is Business Intelligence Engineering?
Business intelligence engineering (also called analytics engineering) is the discipline of building the data infrastructure that powers reliable, self-service business reporting. It combines data modelling, transformation (typically using dbt), and visualisation development to create business intelligence systems that users actually trust and use.
Modern BI engineering focuses on the semantic layer defining business metrics once, governing access, and ensuring consistency across all reports. Tools like Power BI, Tableau, and Looker handle visualisation; the real work is building the trusted data foundation underneath.
HST provides BI engineers who build the complete stack from data transformation through visualisation not just pretty dashboards on top of messy data.
What We Build
- Semantic Layer & Metrics
- Metric definitions in dbt (single source of truth)
- Business glossary documentation
- Dimensional models (star schema, snowflake)
- Slowly changing dimensions
- Calculated measures and KPIs
- Dashboard Development
- Executive dashboards
- Operational monitoring
- Financial reporting
- Regulatory compliance reports
- Self-service analytics workspaces
- Power BI Specific
- Semantic models and measures
- Row-level security
- Dataflows and datamarts
- Paginated reports
- Embedded analytics
- Gateway configuration
- Reporting Modernisation
- Excel → Power BI migration
- SSRS → modern BI
- Multiple tools → single platform
- Ad-hoc requests → self-service
- Manual → automated refresh
WHAT YOU GET
Senior BI Engineer
- Power BI
- Tableau
- Looker
- DBT for Semantic Layer
- Dimensional Modelling
- DAX and SQL
Project Manager
- Included Scope
- Comms
- Weekly Status
- Stakeholder Management
Architecture Reviews
- Included 2h/week Design Reviews
- Data Model Optimisation
- Performance Tuning
Data Engineering assist
- Included Pipeline fixes
- Data quality
- Source Integration
SLA & Compliance
- Weekly Demos
- 48-hour remediation on issues we touch
- ISO 27001 & 22301
- DORA Aligned
- GDPR
- Full IP Assignment
One monthly price. One embedded seat. A full bench behind it.
Technology Stack


We mirror your stack. If you're on Power BI with Azure, we work with Power BI on Azure we don't push Tableau just because we know it.
Case Study
Waystone — Fund Administration Reporting
- Challenge
- Waystone's regulatory reporting was built on legacy systems with multiple manual touchpoints.
- Finance reconciled data in Excel, operations used different numbers, and executives didn't trust any of the dashboards. Month-end was a scramble of ad-hoc queries and manual fixes.
- What We Built
- Consolidated reporting into single Power BI environment
- Semantic layer using dbt one definition for every metric
- Automated data pipelines replacing manual Excel exports
- Role-based access controls (fund-level, region-level)
- Audit trail and lineage for Central Bank compliance
- The outcome
- Single source of truth finance, ops, and execs use the same numbers
- Month-end close reduced from days to hours
- Self-service analytics users explore data without IT requests
- Central Bank inspection ready with full data lineage
- 80% reduction in ad-hoc reporting requests
BI Architecture Principles
Semantic Layer First

Governed Self-Service

Trust Before Beauty

Performance Matters

Document Everything

Why companies choose HST over alternatives
Big 4 / Consultancies | BI Tool Vendors | Solo Contractors |  HST HST | |
|---|---|---|---|---|
| BI expertise | Generic consultants | Sell their tool | Variable | Built for Waystone €1.3T+ fund admin, real regulatory pressure |
| Data foundation | Strategy decks | Assume data is ready | Dashboard only | Full stack pipelines through visualisation |
| Business context | Learn your business on your dime | Don’t know your business | Limited domain | Financial services experience built in |
| Speed | 8–12 weeks | Training + self-service | Available | 7–10 days |
| Accountability | Change requests | Your problem | Walks away | SLAs, ISO 27001, IP assignment |
| Pricing | €200k+ projects | License + PS | Hourly | €5–6k/month fixed |
How We Work
Embed

Discover

Build

Enable

Pricing
Precision Pod
€5–6k/month
One engineer
- 1 senior BI engineer
- Embedded in your team PM
- Architecture
- Data engineering assist included Best for: Focused dashboard development
- Single domain
Pair Pod
€10–11k/month
Two engineers
- 2 engineers working together PM
- Architecture
- Data engineering assist included Best for: Enterprise BI rollout
- Multiple business areas
Mini-Team
€15–16k/month
Three engineers
- 3 engineers with mixed specialities PM
- Architecture
- Data engineering assist included Best for: Full analytics platform
- Data + BI + training
- All plans include
Weekly demos, architecture reviews, SLAs, ISO 27001 certified, full IP assignment.
Proof that Reduces Risk
Frequently asked questions
Should we use Power BI, Tableau, or Looker?
Power BI is best for Microsoft shops tight integration with Excel, Teams, Azure. Most cost effective for organisations already paying for Microsoft 365. Tableau is best for data exploration and beautiful visualisations preferred by data-savvy users who want flexibility. Looker is best for embedding and governed metrics LookML provides strong semantic layer. We help you choose based on your existing stack, user skills, and governance requirements.
Why do our dashboards show different numbers than Excel?
Almost always a definition problem, not a tool problem. Excel reports often include manual adjustments, different date ranges, or business logic that’s not documented. The fix is defining metrics once in a semantic layer and ensuring all reports (including Excel exports) use the same definitions. We audit your current reports to identify discrepancies before building dashboards.
How long does a BI implementation take?
A focused dashboard (single domain, clean data) can be production-ready in 2-4 weeks. Enterprise BI rollout (multiple departments, data quality work, training) typically takes 3-6 months. We deliver incrementally first dashboards in weeks, not months so you see value early and can adjust scope based on feedback.
Can you help with existing dashboards that nobody uses?
Yes. We often start by auditing existing BI investments understanding why adoption is low. Usually it’s data quality, performance, or trust issues. We fix the foundation and redesign dashboards based on actual user needs, not assumptions about what executives want.
How fast can you start?
7–10 business days from signed agreement to engineer embedded in your team.
Give us 20 minutes. We'll show you what trusted BI looks like.
Find The Perfect Solutions For Your Project
Managed Team
Your product, our dedicated team. From concept to conception, we handle it all.
Staff Augmentation
Need extra hands? Our experts seamlessly join your team, providing the skills you need, when you need them.
Fixed Cost


One Team, One Dream
Build Trust with Every Interaction
Improve Everything
Own It
Obsessed: Over Results
Proven Excellence
Partners in Precision
Who Are We ?
Creativity, Efficiency, & Advanced AI
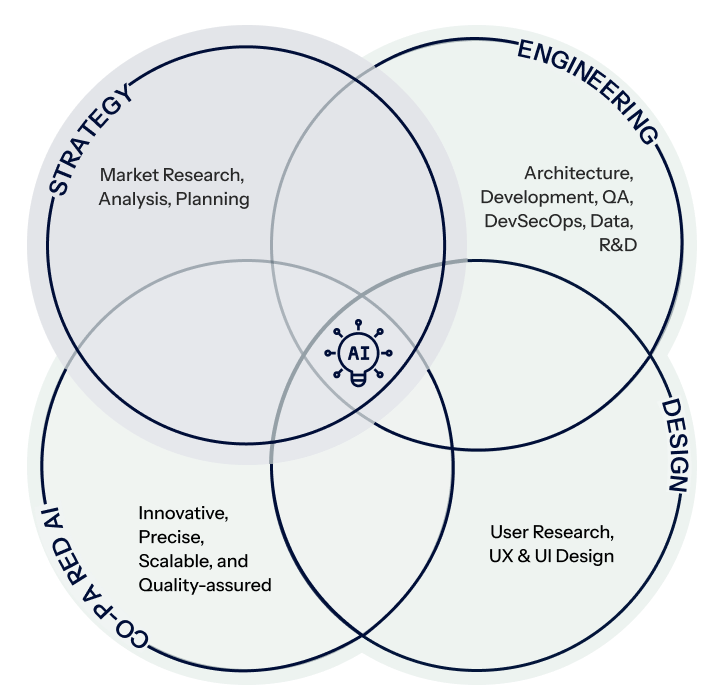

Strategy
Engineering
Design
Co-paired AI
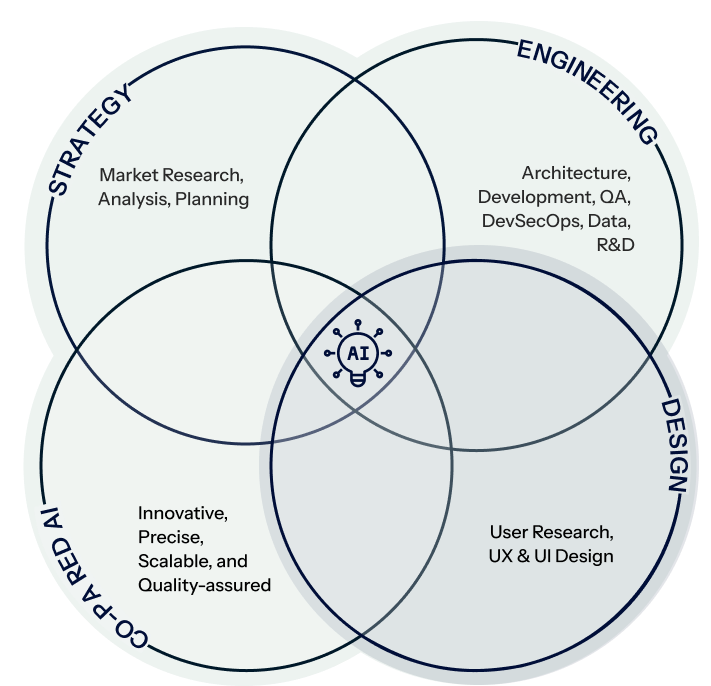
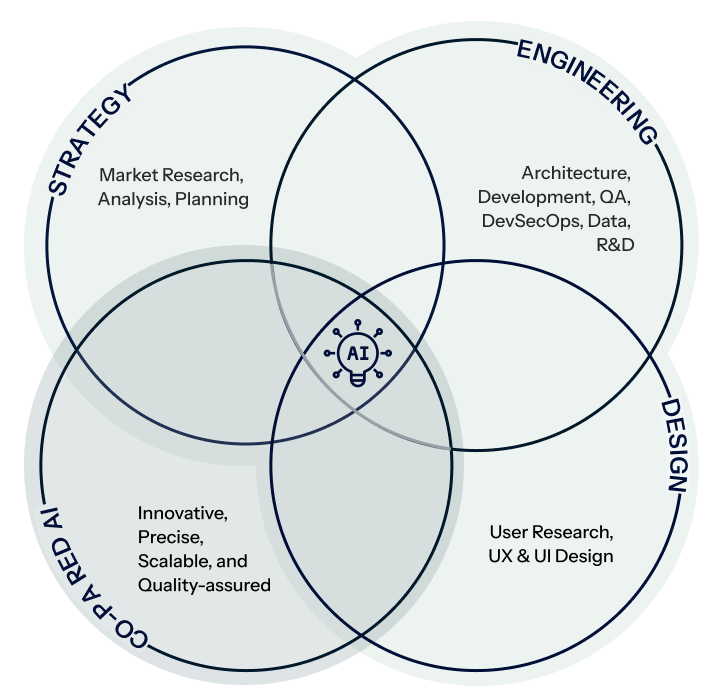
Strategy
Engineering
Design
Co-paired AI
Contact Us
Tell us about your custom software project
Let our team, be your team
Get a technical conversation about your project — not a slide deck. Whether you need AI integration, a software engineering team, or a data platform, we’ll tell you honestly if we’re the right fit.